用 Matlab 手动提取图片中的曲线坐标
贡献者: addis
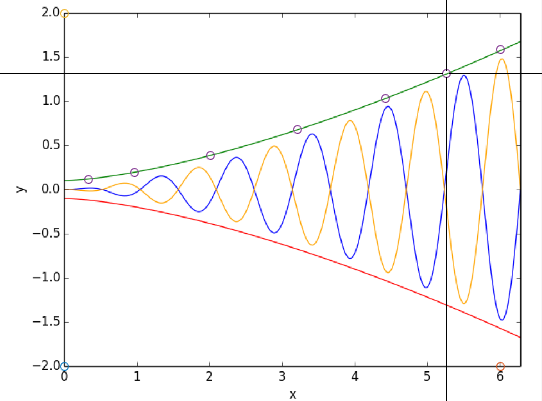
以下给出一个 Matlab 代码用于手动提取图片中的曲线坐标。要使用,可以直接运行,数据将保存到当前目录的 plot2data.mat 文件中。也可以在命令行运行 [x,y] = plot2data;。使用步骤如下
- 运行后会弹出文件浏览窗口,选择要提取的图片。图片会展示在新的画图窗口。
- 接下来有 7 秒钟的时间用画图窗口中的放大按钮放大坐标原点,然后自会动弹出十字叉丝,用于提取原点位置。
- 用同样的方式放大坐 $x$ 轴最刻度并提取。
- 用同样的方式放大坐 $y$ 轴最大刻度并提取。
- 用同样的方式放大到图中的某一部分,并用十字叉丝提取若干坐标点。
- 按回车确认,选取的坐标点会在图中标记为圆圈。按回车重复上一步骤。
- 提取完最后一组后,要结束输入
1并按回车。 - 输出数据的 $(x, y)$ 坐标的范围分别从 $0$ 到 $1$,用户需要根据图中的具体坐标做缩放和平移即可:
x = (xmax - xmin)*x + xmin,以及y = (ymax - ymin)*y + ymin
图 1:用 Matlab 提取曲线坐标
代码 1:plot2data.m
% Data Extractor for Plot
% x and y are both scaled to the range [0,1]
function [x,y] = plot2data
t_pause = 12; % [s]
disp('请选择图片')
[filename,path]=uigetfile('*.*');
cd(path);
I = imread(filename);
figure; imshow(I); hold on;
disp('放大图片以选取坐标原点 (倒计时)');
pause(t_pause);
disp('选取坐标原点')
P0 = ginput(1); scatter(P0(1),P0(2));

disp('放大图片以选取 x 轴最大值 (倒计时)');
pause(t_pause);
disp('选取 x 最大值')
Px = ginput(1); scatter(Px(1),Px(2));

disp('放大图片以选取 y 轴最大值 (倒计时)');
pause(t_pause);
disp('选取 y 最大值')
Py = ginput(1); scatter(Py(1),Py(2));
P = [];
while 1
    disp('放大图片以选取图中一组数据点 (倒计时)');
    pause(t_pause);
    disp('选取图中一组数据点')
    temp = ginput;
    if ~isempty(temp)
        scatter(temp(:,1),temp(:,2));
        P = [P; temp];
        if nargout == 0
            save plot2data.mat P
        end
    end
    temp = input('继续:回车; 结束:1');
    if ~isempty(temp)
        break;
    end
end
x = (P(:,1)-P0(1))/(Px(1)-P0(1));
y = (P(:,2)-P0(2))/(Py(2)-P0(2));
save plot2data.mat x y
end
致读者: 小时百科一直以来坚持所有内容免费无广告,这导致我们处于严重的亏损状态。 长此以往很可能会最终导致我们不得不选择大量广告以及内容付费等。 因此,我们请求广大读者热心打赏 ,使网站得以健康发展。 如果看到这条信息的每位读者能慷慨打赏 20 元,我们一周就能脱离亏损, 并在接下来的一年里向所有读者继续免费提供优质内容。 但遗憾的是只有不到 1% 的读者愿意捐款, 他们的付出帮助了 99% 的读者免费获取知识, 我们在此表示感谢。
友情链接: 超理论坛 | ©小时科技 保留一切权利
