Matlab 球坐标中的分布图
贡献者: addis
- 本文需要更多讲解,便于帮助理解。
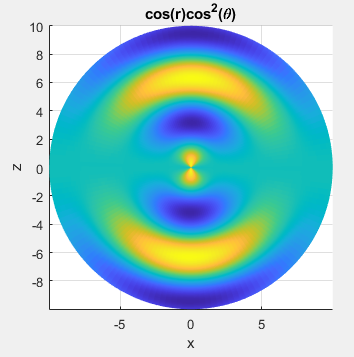
图 1:示例 1
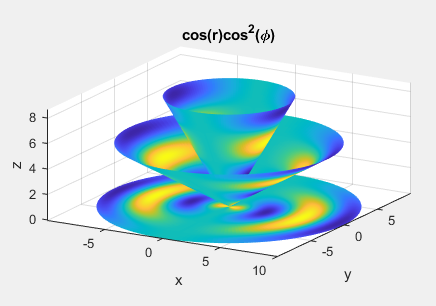
图 2:示例 2
我们可以用 Matlab 内建的 surf(X,Y,Z,Val) 函数在空间中画出任意曲面。其中 X,Y,Z,Val 是尺寸相同的 2 维矩阵,分别代表曲面上每个网格的各点。
代码 1:surfSph.m
% surf() in spherical coordinate
% usage 1. R,Th,Ph,Val are 2D matrices in same shape
% usage 2. R,Th,Ph are vector,vector,scalar
% usage 3. R,Th,Ph are vector,scalar,vector
function h = surfSph(R,Th,Ph,Val,varargin)
% resize
if isvector(R) && isvector(Th)
    [R,Th] = ndgrid(R, Th);
end
if isvector(R) && isvector(Ph)
    [R,Ph] = ndgrid(R,Ph);
end
if isscalar(Th)
    Th = Th*ones(size(R));
end
if isscalar(Ph)
    Ph = Ph*ones(size(R));
end
if ~isequal(size(R),size(Th)) || ...
    ~isequal(size(Th),size(Ph)) || ...
    ~isequal(size(Ph),size(Val))
    error('wrong shape for Th, Ph, Val');
end
% plot
[X,Y,Z] = Sph2Cart(R, Th, Ph);
h = surf(X,Y,Z,Val,varargin{:});
view(0,0);
shading flat; axis equal;
xlabel x; ylabel y; zlabel z;
Rmax = max(R(:));
axis([-1, 1, -1, 1, -1, 1]*Rmax);
set(datacursormode(gcf), 'UpdateFcn', @datatip);
cameratoolbar;
end
示例 1
代码 2:surfSph_demo1.m
Nr = 200; Nth = 150;
R = linspace(0, 10, Nr);
Th = linspace(0, 2*pi, Nth);
[R, Th] = ndgrid(R, Th);
Ph = 0;
Val = cos(R) .* cos(Th).^2;
figure; surfSph(R,Th,Ph,Val);
title('cos(r)cos^2(\theta)');
view(0, 0);
示例 2
代码 3:surfSph_demo2.m
Nr = 200; Nth = 150;
R = linspace(0, 10, Nr);
Ph = linspace(0, 2*pi, Nth);
[R, Ph] = ndgrid(R, Ph);
Val = cos(R) .* cos(Ph).^2;
figure; surfSph(R,pi/6,Ph,Val);
hold on; surfSph(R,pi/3,Ph,Val);
surfSph(R,pi/2,Ph,Val);
xlabel x; ylabel y; zlabel z;
title('cos(r)cos^2(\phi)');
view(30, 16);