多普勒效应与音爆(Matlab 绘图)
贡献者: ACertainUser; addis
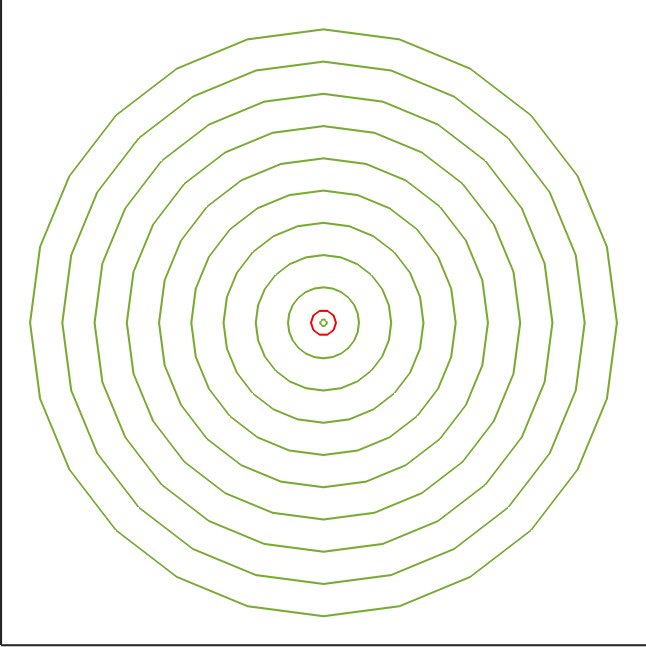
图 1:静止波源产生的波,波长是均匀的
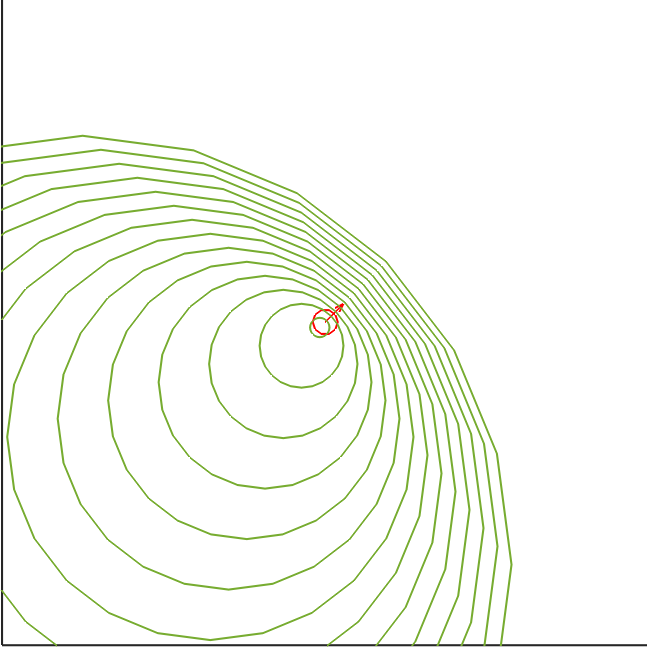
图 2:但是波源运动时,运动方向前的波长减少,后方的波长变长
我们知道多普勒效应:当声源在运动时,观察者会发现声源的频率改变了,并且频率的改变与观察者的位置、声源的速度等有关。
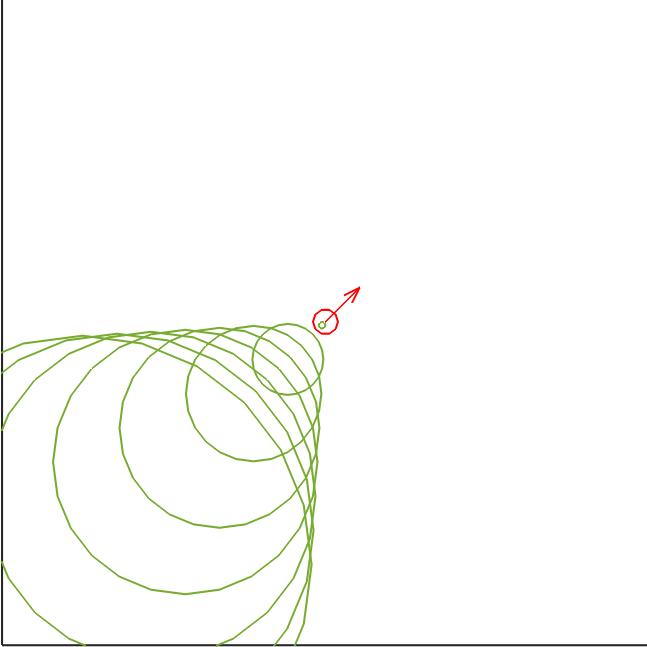
图 3:波源速度超过波速时,产生典型的锥面
同时,如果波源的速度超过波速(例如超声速,至少目前我们还不能超光速),那么波甚至追不上波源,并会在波源前方产生一个锥形区域。锥形的角度与波源速度有关,越高的波源速度会产生越尖锐的锥形。这类问题被称为音爆。
以下的 octave/matlab 程序简要地展示了多普勒效应:每一圈代表一个波峰,两圈之间的间隙相当于半波长。可见,在波源前方,波长被压缩、频率升高;而在后方波长延长、频率降低。如果你使用 matlab,可能需要修订部分代码以符合 matlab 语法。
注意,这个程序可能存在一定的 bug,因此只适合定性演示。
clc
clear

global template
global theta
global n
global dt

figure()
hold on
axis equal
axis([-20 20 -20 20])

template = struct('x',0,'y',0,'vx',0,'vy',0,'h',0,'lineh',0);
theta = 30; %分辨率
n = 360/theta;
dt = 0.25; %时间步长

b(1,1) = struct(template);

charge = struct(template);
charge.x=-10;
charge.y=0;
charge.vx=1.5; %波源速度,0=静止,1=波速。如果波源速度>1,就会产生音爆
charge.vy=0;
charge.h=scatter(charge.x,charge.y,'MarkerEdgeColor','r');
charge.lineh = 0;

function b = create(b,charge, tick)
  global template
  global theta
  global n

  for i = 1:n
    b(i,tick) = struct(template);
    b(i,tick).x = charge.x;
    b(i,tick).y = charge.y;
    b(i,tick).vx = cosd((i-1)*theta);
    b(i,tick).vy = sind((i-1)*theta);
    b(i,tick).h = scatter(b(i,1).x,b(i,1).y,'MarkerEdgeColor','k');
    b(i,tick).lineh = 0;
  end

  for i = 1:n
    if i == 1
      b(i,tick).lineh
      = line([b(n,tick).x b(i,tick).x],[b(n,tick).y b(i,tick).y]);
    else
      b(i,tick).lineh
      = line([b(i-1,tick).x b(i,tick).x],[b(i-1,tick).y b(i,tick).y]);
    endif
  end
  drawnow;
end

function [b, charge]=update(b, charge,tick)
  global n
  global dt

  charge.x+=charge.vx*dt;
  charge.y+=charge.vy*dt;
  set(charge.h,'XData',charge.x, 'YData',charge.y);

  for t = 1:tick
    for i = 1:n
      b(i,t).x += b(i,t).vx * dt;
      b(i,t).y += b(i,t).vy * dt;

      if b(i,t).h~=-1
        if abs(b(i,t).x) > 20 || abs(b(i,t).y) > 20
          delete(b(i,t).h);
          b(i,t).h = -1;
        else
          set(b(i,t).h,'XData',b(i,t).x, 'YData',b(i,t).y);
        end
      end

    end
  end
end

function b = updateLine(b, tick)
  global n
  for t = 1:tick
    for i = 1:n

      if b(i,t).lineh ~= -1
        if i == 1
          if b(i,t).h == -1 && b(n,t).h == -1
            delete(b(i,t).lineh);
            b(i,t).lineh = -1;
          else
            set(b(i,t).lineh,
            'XData',[b(n,t).x b(i,t).x],
            'YData',[b(n,t).y b(i,t).y]);
          endif
        else
          if b(i,t).h == -1 && b(i-1,t).h == -1
            delete(b(i,t).lineh);
            b(i,t).lineh = -1;
          else
            set(b(i,t).lineh,
            'XData',[b(i-1,t).x b(i,t).x],
            'YData',[b(i-1,t).y b(i,t).y]);
          endif
        endif
      end

    end
  end
end


tick = 1;
_create = 0;
t=0;

b = create(b, charge, 1);

for t=0:100
  _create++;
  [b, charge] = update(b,charge, tick);
  b = updateLine(b, tick);

  if _create >= 10 %创建圈的时间间隔,相当于波的频率
    _create = 0;
    tick++;
    b = create(b, charge, tick);
  end

  drawnow
  pause(0.1)
end


